Laboratory Software for Ultrafast Spectroscopy
Refactoring a 25-year legacy laboratory software to Python
Business Case
A research group's core control software became a critical bottleneck, after being developed organically over 25 years by researchers without version control or formalized software engineering standards. The codebase had diverged significantly across different laboratory facilities. Missing centralized knowledge management and burdened by undocumented algorithms, the existing setup impeded the development of increasingly complex experiments, slowing down scientific progress.
Outcome
We architected and deployed a standardized, fully documented, Python-based software suite that successfully unified the diverging codebases across the laboratories. By enforcing a clean separation of concerns across hardware control, data acquisition, processing, and visualization, the new platform unlocked raw ADC data retention and standardized data storage formats. This architectural overhaul not only improved optical setup tuning but directly enabled the successful implementation of the novel FT-2D-VIPER experiment, transforming the codebase from an experimental roadblock into a research accelerator.
Detailed Report
Introduction to Femtosecond Spectroscopy
Femtosecond spectroscopy is an advanced optical technique that utilizes ultrashort laser pulses lasting mere quadrillionths of a second ( seconds) to capture molecular dynamics in real time. Operating on this incredibly brief timescale allows researchers to observe fundamental processes like chemical bond breaking, energy transfer, and molecular rearrangements precisely as they occur.
Experiments range from broadband pump setups to multi-pulse experiments utilizing three or more excitation pulses. Advanced iterations, such as FT-2D-IR (Fourier Transform Two-Dimensional Infrared) and VIPER (Vibrationally Promoted Electronic Resonance) spectroscopy, map out the complex vibrational couplings and structural landscapes of molecular systems with high spatial and temporal precision. Executing these sophisticated experiments relies heavily on the precise, synchronized control of ultra-fast lasers, high-speed Analog-to-Digital Converters (ADCs), and complex optical delay stages.
Linear spectroscopy
In traditional spectroscopy, a broad-band, often continuous-wave light source is used to detect which frequencies of light excite a material. For these specific frequencies, the energy of the light is absorbed by the molecules and converted into a different form of energy. Depending on the frequency range, photons might excite an electron of the molecule into a higher electronic state (UV/Vis) or excite a vibrational mode of the molecule (IR).
This excitation process causes the intensity of the light source to drop at the specific frequency, which can be measured with an appropriate detector in either the frequency domain or the time domain. From this, a human-interpretable absorption spectrum can be computed:
With:
- : The Absorbance of the material at a specific angular frequency . It is a dimensionless measure of how much light is absorbed by the sample.
- : The Molar attenuation coefficient (or molar extinction coefficient) at frequency . It represents how strongly the chemical species absorbs light at that specific frequency.
- : The Concentration of the absorbing molecular species in the sample.
- : The Optical path length, which is the physical distance the light travels through the material (e.g., the width of the sample cuvette).
The absorption bands in the spectrum are distinctly tied to the bonds between different atoms, allowing linear spectroscopy to identify the molecular and atomic composition of a material. However, this yields no information about what happens with the absorbed energy, the time scale of the excitation decay, or how the energy is ultimately dissipated.
Second order spectroscopy
Higher-order spectroscopies utilize several light pulses of very short duration. The most basic second-order experiment uses two broadband pulses. The first pulse (the pump pulse) excites the sample, similar to linear spectroscopy. Instead of measuring the spectrum resulting from this pump pulse, a second “probe” pulse is used.
The probe reaches the sample femto- to picoseconds after the pump pulse. This is achieved by introducing a variable additional path length to the beam path of the probe pulse via a highly precise delay stage. The absorption spectrum of this probe pulse is measured at different delays (). Because researchers are primarily interested in the difference relative to the unexcited state, the difference absorption spectrum for the probe wavelength is computed:
Here denotes the absorbance of the pumped/excited state and the absorbance of with no pump pulse present. The limitation of a broad-band pump pulse is that the sample is excited across all states simultaneously. While system dynamics can be observed, it is impossible to determine which excitation wavelength, and thus which specific part of the molecule, caused the observations.
2D-IR spectroscopy
Hover over any peak in the 2D IR map to reveal its corresponding molecular phenomenon.
In 2D-IR spectroscopy, the broad-band pump experiment is extended so that the frequency information of the excitation pulse is explicitly taken into account. This can be achieved by narrowing the broad-band pump pulse with a Fabry-Perot etalon (or similar device) and gathering the sample response across different excitation wavelengths (). This yields the 2D difference absorption spectrum:
Alternatively, the frequency information of the pump pulse can be measured in the time domain using a Michelson interferometer. Two broadband pump pulses are used, and their coherence time () is scanned. A Fourier Transform is then applied to obtain the 2D-IR difference spectrum, which generally yields better experimental results than frequency-domain measurements.
To summarize, the FT-2D-IR experiment relies on three precisely controlled pulses:
- Two broadband pump pulses, whose coherence time is scanned via a delay stage in the Michelson Interferometer
- One probe pulse, whose delay is stepped with a seperate delay stage, after the 2D-IR spectrum has been measured for a given delay.
Typical features in the 2D-IR Spectrum
When plotted, a 2D-IR difference spectrum consists of pairs of positive and negative features (peaks and troughs) along the diagonal where , as well as off-diagonal “cross-peaks.” Under the standard convention where a decrease in absorption yields a negative signal , these spectral features arise from three distinct quantum pathways.
- Ground State Bleach (GSB) — (Trough)
Mechanism: The pump pulses excite a fraction of the molecular population from the ground vibrational state () to the first excited vibrational state (). The incoming probe pulse therefore encounters fewer molecules in the ground state than it would unpumped.
Result: Less probe light is absorbed at the fundamental transition frequency, creating a negative signal exactly on the diagonal at
- Stimulated Emission (SE) — (Trough)
Mechanism: For molecules promoted to the state, the probe pulse coherently induces a transition back down to the ground state ().
Result: This transition emits a photon collinear and coherent with the probe beam. The detector registers this as an apparent increase in transmitted intensity, overlapping perfectly with the GSB feature at:
- Excited State Absorption (ESA) — (Peak)
- Mechanism: The probe pulse can also induce an upward transition for the population sitting in the state, promoting them to the second excited vibrational state (). This pathway only exists when the pump is active.
- Result: The sample absorbs additional probe intensity, resulting in a positive signal. This peak is located at the coordinates:
The Role of Vibrational Anharmonicity
If molecular vibrations behaved as perfect harmonic oscillators, the energy gap between would equal the gap between . The positive ESA peak would perfectly overlap with the negative GSB/SE trough, canceling out the signal ().
However, real molecular bonds are anharmonic. Using a Taylor expansion of the potential energy surface:
Where is the harmonic frequency and is the anharmonicity constant. The transition energies are:
The difference between these transitions defines the vibrational anharmonicity ():
Because , the transition occurs at a lower frequency (). Consequently, the positive ESA peak is shifted downward along the detection axis (), cleanly separating it from the negative GSB/SE pair.
VIPER spectroscopy
Vibrationally Promoted Electronic Resonance (VIPER) spectroscopy introduces an additional UV/Vis excitation pulse to prolong the lifetime of the excited states from picoseconds to milliseconds. The UV/Vis pulse excites the already vibrationally excited molecules to a higher electronic state. It illuminates the sample after a delay following the IR pump pulse. Establishing a new time-domain iteration of this experiment, Fourier Transform-VIPER, was the core scientific driver behind modernizing the laboratory’s software stack.
The Legacy Software Bottleneck
Prior to this architectural refactoring, the research group relied on Visual Basic 6 to control the hardware for frequency-domain VIPER experiments. This software, originally brought in by the research group leader over 25 years ago, had been expanded organically by generations of domain specialists in spectroscopy, not experts in software engineering.
Because its inception pre-dated modern version control tools like Git, the codebase suffered from duplication, a lack of abstraction, and no centralized documentation. Critical knowledge was lost; for instance, the tuning algorithm for the Fabry-Perot Etalon relied on hardcoded constants whose physical derivations have been lost to time.
Concurrently, a second setup had been built for time-domain FT-2D-IR experiments using LabVIEW. While LabVIEW’s graphical programming interface is accessible to beginners, it had degraded into unmaintainable “spaghetti code” as the project scaled. Furthermore, it created an explicit dependency on expensive, proprietary software. Establishing FT-VIPER required physically and logically merging the hardware and software of both distinct setups.
Architectural Refactoring to Python
To overcome these limitations, we designed and implemented a completely new measuring software system from scratch using Python. The architecture was built on strict engineering principles:
Unified Abstraction: Unifying and replacing both the disparaged Visual Basic and LabVIEW solutions into a single, non-proprietary platform.
Version Management & CI/CD: Transitioning to Git for version control to ensure structured, maintainable, and safe concurrent development across multiple researchers.
Documentation as Code: Implementing centralized, auto-generating documentation via Sphinx, coupled with rigorous Python doc-strings to capture legacy algorithmic knowledge.
Code Standardization: Enforcing PEP 8 compliance and automated code formatters (like Black) to guarantee consistency.
Separation of Concerns & Modular Layout
Hardware Modules: The foundation of the system. We built standalone Python interfaces for every piece of equipment, including National Instruments ADCs, Physik Instrumente motorized stages, Horiba Triax spectrometers, custom microcontroller electronics, and more. Each module can be executed as standalone for direct hardware testing.
Hardware Configuration Files (JSON): To ensure the software is portable across different laboratories, all hardware parameters (COM ports, initial velocities, pixel linearization fit parameters) were abstracted into human-readable JSON files. This modularity allows a new lab to simply swap a config file rather than editing core code.
High-Performance Data Processing: Centralized computation routines heavily utilizing NumPy. Algorithms were aggressively optimized; for instance, the data sorting method was built to handle 100 kSamples per second to prevent data flow bottlenecks during live acquisition. We also solved the fundamental mathematical challenge of averaging collected data to guarantee optimal signal-to-noise ratios.
Experiments & GUI Generation: The user interface was dynamically generated using QtDesigner UI files mapped to localized Python widgets. Because standard libraries like matplotlib were too slow for the required update rates, we integrated pyqtgraph to render 2D plots and charts in near real-time.
Conclusion
The Python refactoring was a resounding success. Not only did it serve as a robust replacement for the legacy systems, but it inherently improved the performance of all previous experimental routines. Most importantly, the modularity of the new architecture allowed us to rapidly implement two entirely new experiment types:
- Fourier Transform VIPER
- UV/VIS Pump - IR Probe with Split Sample Cell
This proves that the software had evolved from a rigid constraint into a flexible foundation for future scientific discovery.
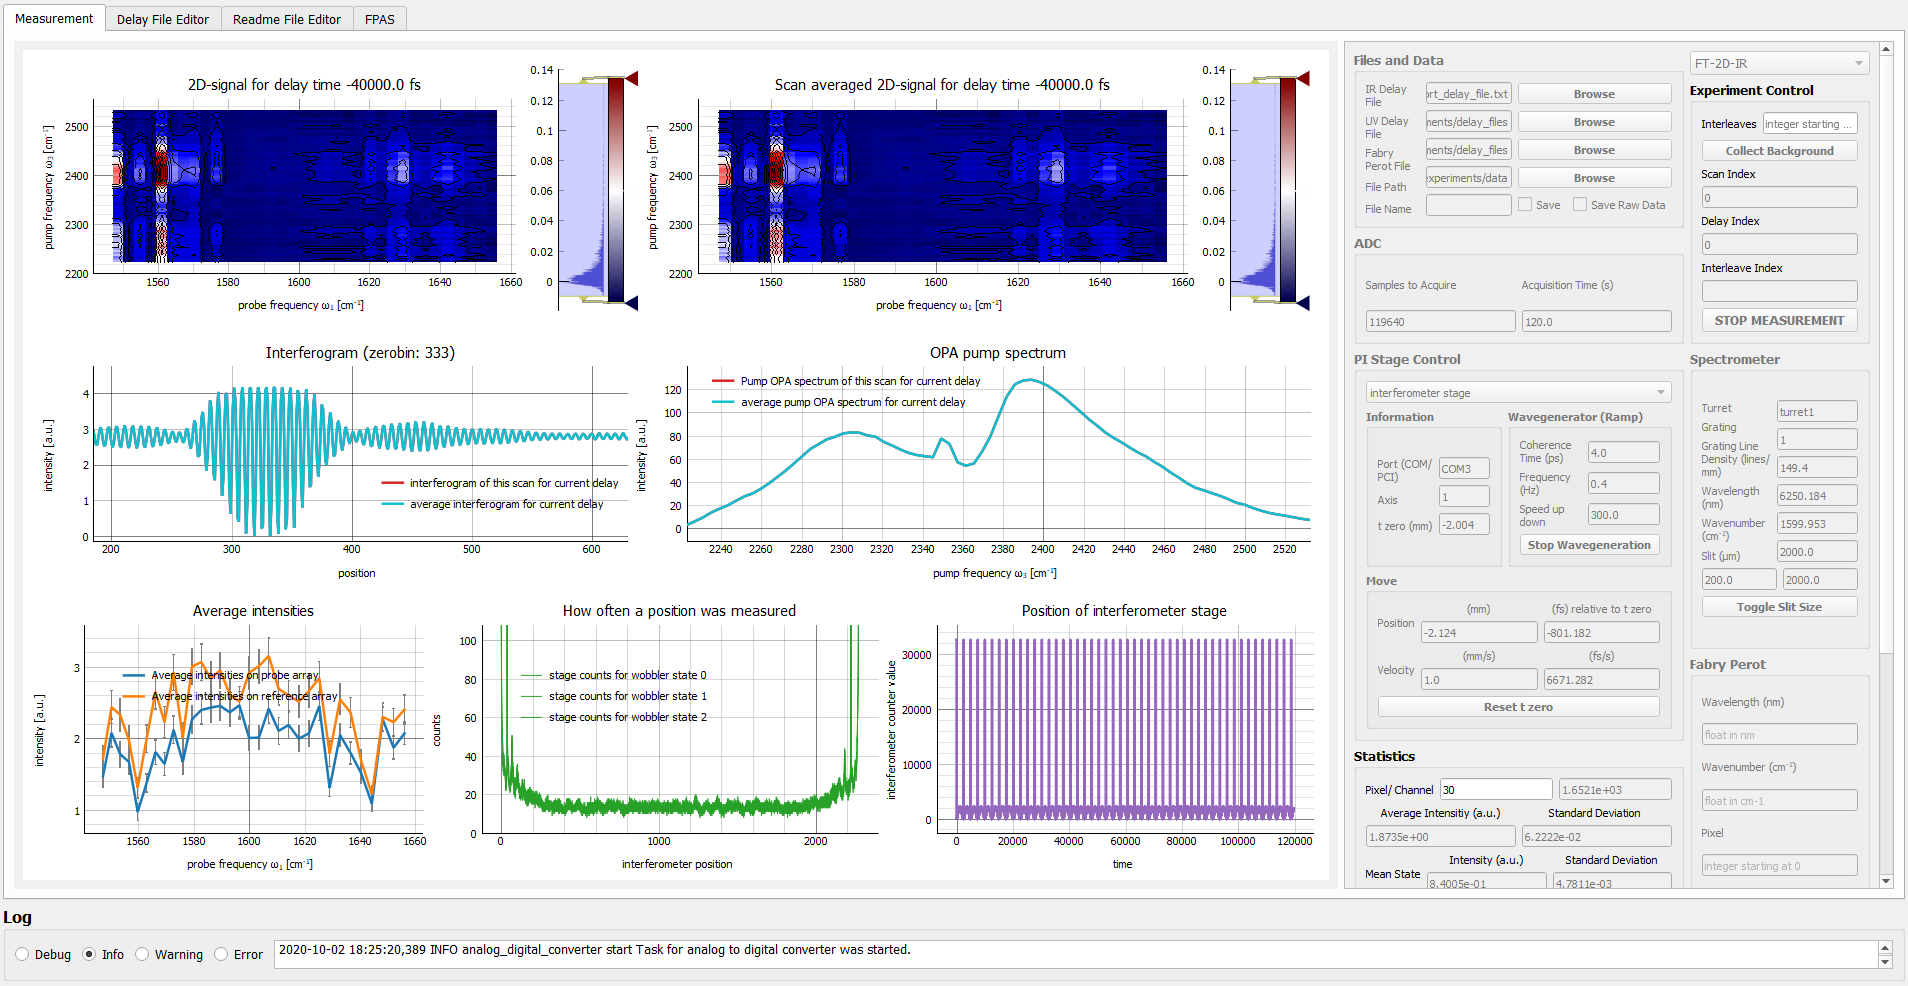
Lab-Software Graphical Interface
Publications & Further reading
- Jagan Laboratory Software Documentation
- Deniz, E., Löffler, J. G., Kondratiev, A., Thun, A. R., Shen, Y., Wille, G., & Bredenbeck, J. (2022). High-precision background correction and artifact suppression for ultrafast spectroscopy by quasi-simultaneous measurements in a split-sample cell. Review of Scientific Instruments, 93(3). https://doi.org/10.1063/5.0079958
- Brunst, H., Masood, H. M. A., Thun, A. R., Kondratiev, A., Wille, G., van Wilderen, L. J. G. W., & Bredenbeck, J. (2022). A Triplet Label Extends Two‐Dimensional Infrared Spectroscopy from Pico‐ to Microseconds. Angewandte Chemie International Edition, 61(49). https://doi.org/10.1002/anie.202211490
License
All original content by Rafael Thun is licensed under a Creative Commons Attribution 4.0 International License.
© 2026 Helionox GmbH.