Benchmark Index Control Suite & Reset Risk Dashboard
A governance and compliance platform, born out of the 2014 LIBOR scandal, to mitigate and manage the operational risk of collusion in rate markets.
Business Case
Following the 2014 LIBOR scandal, banks required a robust system to manage and monitor transactions influencing the index market (i.e.: EURIBOR, SOFR, etc.) to strictly control operational risks. For this, the regulatory requirements are documented in the EU BMR.
Outcome
We managed the design, full-stack implementation, and team leadership for these tools. These two large-scale enterprise platforms now support 400+ daily users and successfully monitor approximately $12 billion USD of operational risk.
Detailed Report
The LIBOR Scandal and Shift in Index Control
The 2012 LIBOR scandal exposed systemic vulnerabilities in how global benchmark rates were calculated, fundamentally altering the regulatory landscape for financial indices. Because LIBOR relied on subjective, self-reported estimates from a panel of major global banks rather than actual, hard transaction data, it invited widespread manipulation. Derivatives traders at panel banks colluded internally and externally to artificially alter daily submissions to maximize trading profits. Simultaneously, during the 2008 financial crisis, banks “low-balled” their submissions to project a false image of financial stability.
This massive breach of trust revealed a severe lack of governance and benchmark control. In response, global regulators mandated a shift away from subjective, quote-based IBORs (Interbank Offered Rate) toward robust, transaction-backed Risk-Free Rates (RFRs), such as SOFR (Securities Overnight Financing Rate) and €STR (Euro Short-Term Rate). To prevent future manipulation and strictly control operational and conflict-of-interest risks, the European Union codified these expectations in the EU Benchmark Regulation (EU BMR 2016/1011). The EU BMR enforces strict governance frameworks, data integrity standards, and rigorous audit trails for anyone contributing to, administering, or using financial benchmarks.
How Does A Benchmark Index Work
A financial benchmark or index is a standardized, regulated reference rate used to measure the performance of a market, determine the value of a financial instrument, or calculate the cost of borrowing. It is formally defined by a specific methodology that dictates how index related data is used. Modern benchmarks fall into two main categories: transaction-based indices (such as SOFR, which averages actual overnight repo transactions) and macroeconomic/market indices (such as the S&P 500 or inflation indices like the CPI). A designated index administrator oversees this process under strict regulatory governance to ensure the rate is transparent, accurate, and resilient against manipulation.
These benchmarks serve as the invisible scaffolding of the global financial ecosystem, holding immense importance for both institutions and everyday individuals:
For Institutions: Benchmarks are critical for pricing risk, valuing portfolios, and maintaining market liquidity. Institutional investors use them to measure the performance of asset managers (e.g., comparing a mutual fund against the MSCI World Index). Furthermore, derivatives, corporate bonds, and trillions of dollars in complex financial contracts rely on these indices to calculate interest payments and settlement values. Without trusted benchmarks, institutional trading and capital allocation would come to a halt.
For Everyday Individuals: While mostly operating behind the scenes, benchmarks directly dictate the cost of daily life. When a consumer takes out a variable-rate mortgage, an auto loan, or a student loan, the interest rate they pay is typically calculated as a “benchmark rate plus a premium” (e.g., SOFR + 2%). Similarly, credit card interest rates and the returns on personal savings accounts or retirement funds fluctuate based on the movement of these core indices.
Enterprise Software: Benchmark Index Control Suite
The Benchmark Index Control Suite was implemented to mitigate fraudulent personnel behavior brought to light by the LIBOR scandal. We managed the design, full-stack implementation, and team leadership for these tools. Today, these two large-scale enterprise platforms support over 400 daily users and successfully monitor approximately $12 billion USD in operational risk.
At its core, the platform serves as a risk control and governance ecosystem utilizing sophisticated human-in-the-loop mechanics to ensure that indices and trades strictly comply with global regulatory frameworks. Controls span from multi-stage review workflows for specific contributing trades to structural Conflict of Interest controls—which extend to auditing physical trader workspace proximity.
The suite is anchored by three critical functional components:
1. Benchmark Index Inventory
The Benchmark Inventory serves as the definitive Single Source of Truth for the platform, cataloging every benchmark the bank contributes to. In Tier 1 banking, “contributing” involves submitting structural data (such as interest rates or currency pricing) to central administrators (e.g., Bloomberg or central banks) to calculate broader market rates.
This specialized dashboard tracks:
- Inventory Cataloging: Comprehensive mapping of all active benchmark participations (e.g., SOFR, EURIBOR).
- Granular Ownership: Pinpointing the exact internal business unit and geographic region (e.g., APAC, AMER) responsible for data submission.
- Risk Classification: Real-time classification flags determining whether an index is “In Scope” (highly regulated) or placed on a “Watchlist”.
- Regulatory Compliance: Dedicated oversight of “CFTC Benchmark” flags, explicitly highlighting indices subject to the strict jurisdiction and anti-manipulation enforcement of the US Commodity Futures Trading Commission.
- Audit State: Active tracking of compliance states (e.g., “Reviewed”) to verify that contributions have undergone recent validation.
2. The Auditlog: The “Who, What, and When”
The Audit Log functions as a chronological, immutable record of every single action executed within the ecosystem. Serving as the system’s “black box,” its primary objectives are absolute traceability and total accountability. When regulators query process integrity, the Audit Log provides definitive, legally binding proof of operational diligence.
Key Operational Applications:
- Forensic Investigation: If anomalies are identified in historical benchmark submissions, investigators can instantly pinpoint the exact user, structural changes, and accompanying professional commentary.
- Anomaly & Unauthorized Activity Detection: By tracking every login, comment modification, and sign-off action, the log immediately flags attempts to bypass standard operating procedures.
- Process Verification: Capturing mandatory justification inputs at distinct approval stages guarantees that multi-step review protocols are actively followed, rather than passively bypassed. at different stages. This proves that a multi-step review process is actually taking place.
3. The Control Archive
The Control Archive centralizes all active and historical operational controls (the check-and-balance verification workflows required of the bank). It serves as a management dashboard for internal compliance and risk teams, while simultaneously acting as the direct reporting gateway for external auditors.
Key Operational Applications:
- Lifecycle Task Management: Visually maps controls across their active lifecycles, separating “Active” evaluations from “Completed” histories.
- Schedules & Deadlines: Governs explicit start and expiration windows for individual compliance reviews.
- Governance & Defense-Line Separation:
- 1st Line (Business): The people performing the actual data entry and daily checks.
- 2nd Line (Compliance/Risk): The people overseeing the 1st line to ensure they aren’t making mistakes or manipulating data.
Reset Risk Dashboard: Monitoring “Incentive to Manipulate”
The Reset Risk Dashboard is a highly specialized sensitivity analysis engine. It quantifies exactly how much a trader’s portfolio value moves in response to a minor, 1-basis-point () shift in an underlying benchmark rate.
- Core Mechanics: It calculates the “Delta” (sensitivity) of complex books to benchmark movements.
- Mitigating Manipulation Risk: This dashboard serves as the frontline defense against incentive-driven market manipulation. In benchmark governance, a portfolio exhibiting outsized sensitivity to a specific fixing window is a critical risk indicator.
- Proactive Oversight: If a trading book stands to gain or lose millions based on a fractional shift in a rate, compliance officers are instantly alerted. This allows risk teams to place high-sensitivity traders under targeted surveillance precisely when benchmark fixing windows occur.
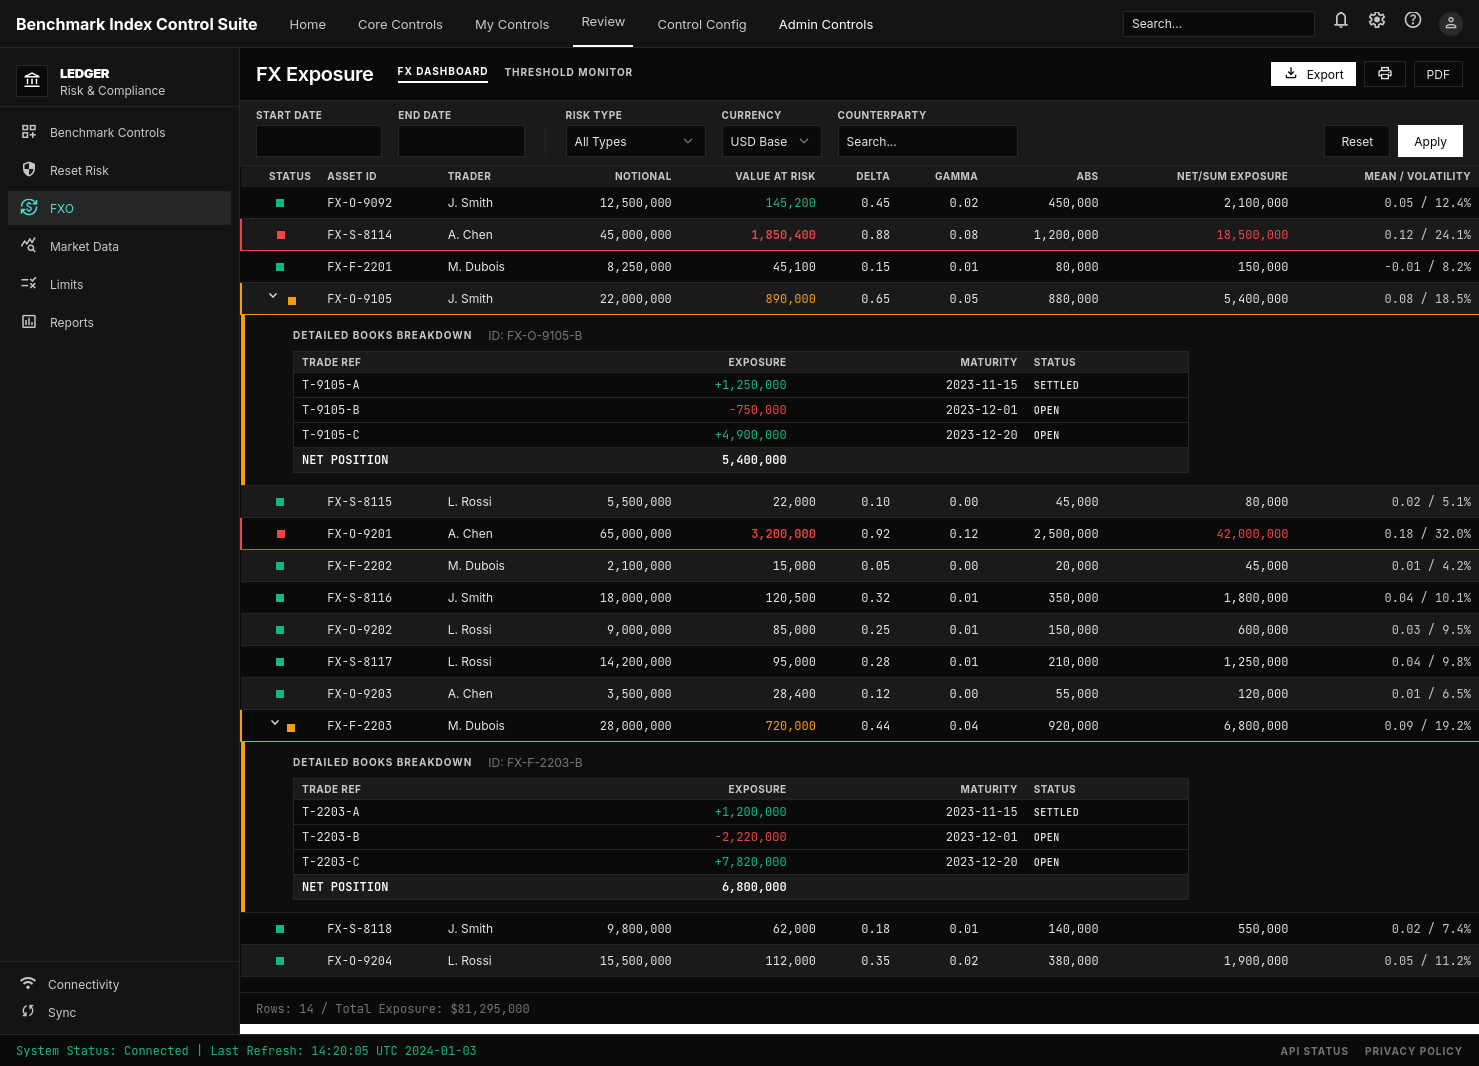
Foreign Exchange Options Dashboard: Monitoring “Concentration and Complexity”
The Foreign Exchange Options (FXO) Dashboard is an exposure and concentration monitoring engine designed to map the scale, density, and structural risks of complex FX derivative positions across the enterprise.
- Core Mechanics: The platform aggregates and monitors total aggregate notionals alongside position concentrations across individual traders, books, and currency pairs.
- Mitigating Systemic Risk: Unlike simple linear instruments, FX Options are inherently non-linear derivatives whose valuations fluctuate unpredictably based on volatility and underlying rate shifts. This structural complexity can obscure latent market manipulation.
- Preventing Cascade Failures: If an individual trader or a specific currency pair holds a disproportionate concentration of the bank’s total FX exposure, a minor pricing anomaly in a benchmark index could trigger a localized capital shortfall. This dashboard ensures the enterprise maintains strict exposure caps, preventing systemic contagion across interconnected derivative portfolios.
Platform Interface Gallery
License
All original content by Alexander Thorne is licensed under a Creative Commons Attribution 4.0 International License.
© 2026 Helionox GmbH.